Framework
Lead on Leading Indicators
Pick the few inputs that predict the result and coach those, because the result itself cannot be coached.
The steps
- List the lagging indicators you are judged on, such as bookings, attainment and win rate, and accept you cannot move them directly.
- Work backwards to the three or four behaviours and deal conditions that reliably produce them.
- Put those on the dashboard and in every one-to-one, with a number against each.
- Coach the leading indicator in the conversation, with a specific next action, and leave the lagging number alone.
- Check monthly that the leading indicators still predict the result, and change them when they stop.
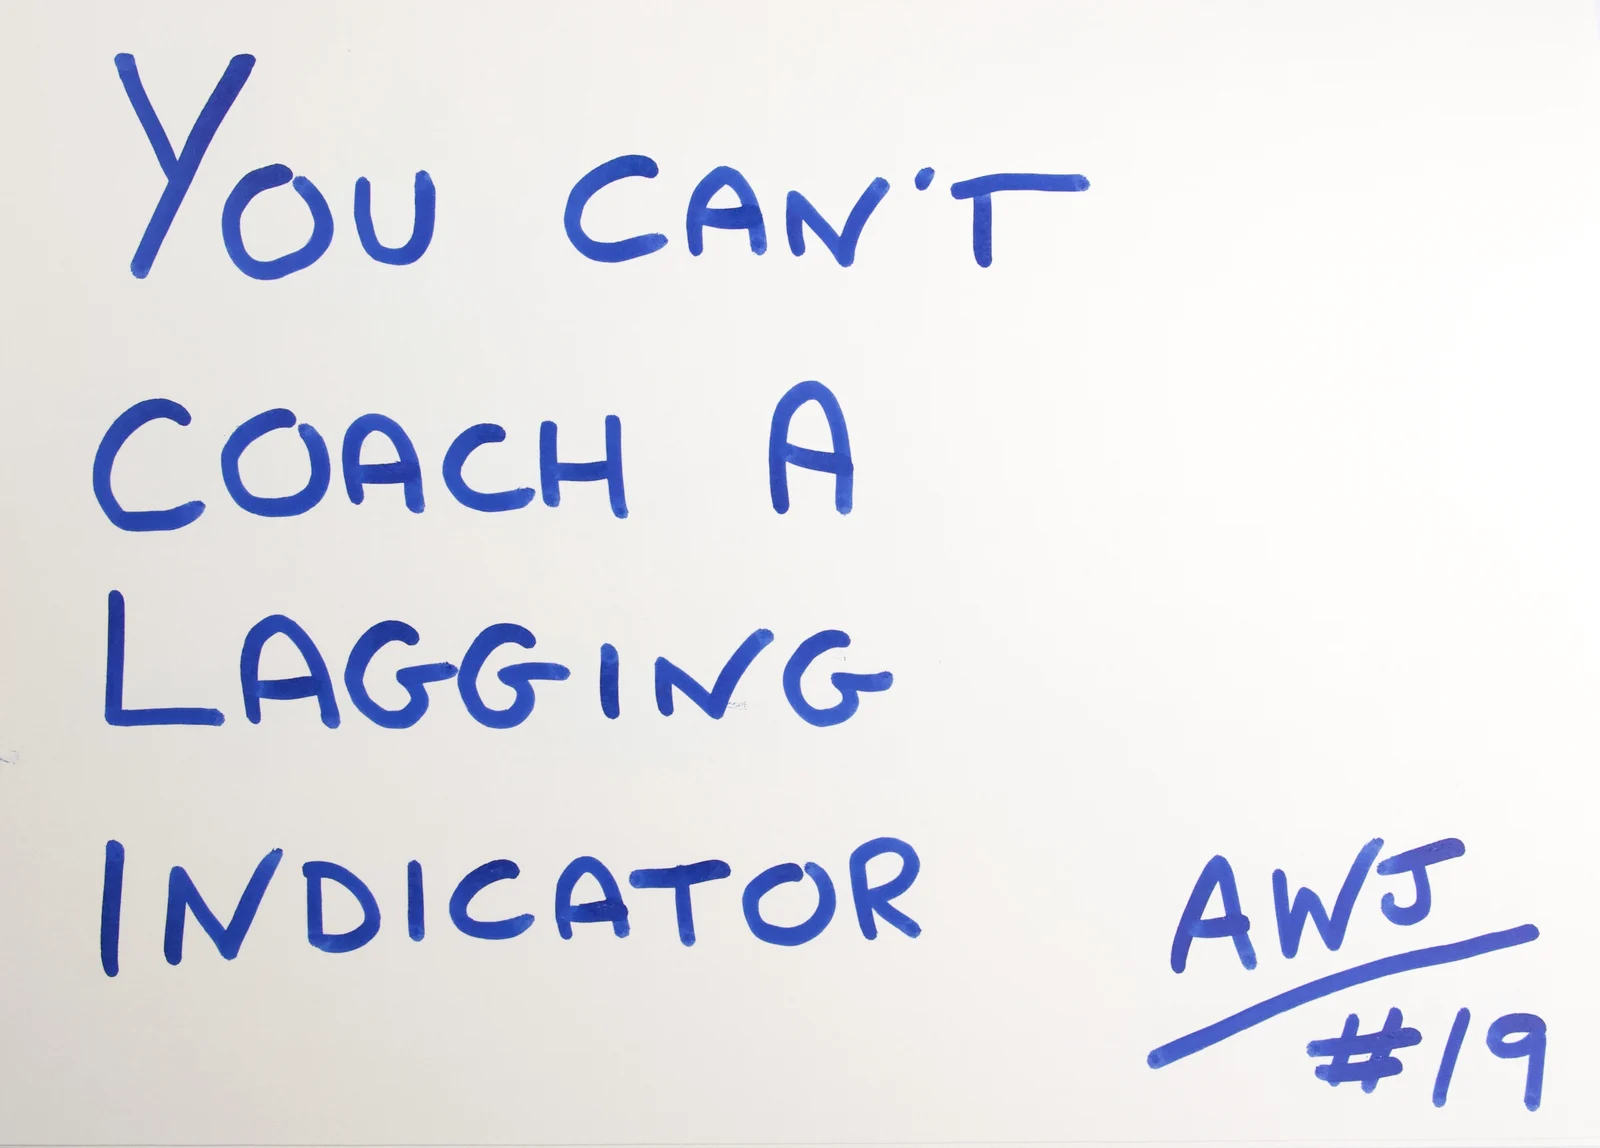
You can’t coach a lagging indicator. Bookings, quota attainment, win rate, churn: by the time any of those is on a dashboard, the work that produced it is over. Telling a rep they are at 40% of target tells them something they knew before you opened your mouth, and no amount of discussing it changes a single decision that led there. A leading indicator is different. It happens earlier, it predicts the result, and it is still in play. The whole model is choosing to lead on those.
It exists because sales leadership defaults to the scoreboard. Attainment sits at the top of every report, every one-to-one starts there, and the conversation that follows is a post-mortem dressed as coaching. Leaders who run this way spend the quarter shouting at a number. The result shows up ninety days after the behaviour that caused it, and by then the only thing left to do is explain it to the board.
How to run it
Start with the lagging indicators you are measured on and accept that you cannot touch them directly. Then work backwards. What, if it happened more, would make bookings go up? For most teams I have led, the answers were the same few things. The quality of MEDDPICC on the top deals. The number of Economic Buyer conversations in a month. The share of new pipeline that carried a tested Champion. Discovery calls where the consequence of doing nothing was named by the customer. Pick three or four, no more, and put a number on each.
Then change the shape of your conversations. The one-to-one starts with the leading indicators, the coaching is about the next action that moves one of them, and the attainment number is mentioned once, if at all. Over a quarter, the lagging number follows, with a lag you can roughly predict. That lag is the forecast.
Where it breaks
It breaks when you pick activity instead of leading indicators. Calls dialled and emails sent are inputs, and the B-Player will happily give you more of them. A leading indicator has to predict the result, which means it has to carry quality: a Champion who passed the test, a Metric the customer agreed, an Economic Buyer meeting that actually happened. It breaks when the indicator becomes the target and people start gaming it, which is why you check monthly that it still predicts anything. It breaks when leaders keep both dashboards and still coach from the lagging one out of habit.
And it breaks when the board only wants the lagging number and the leader stops showing them the leading ones. Show them anyway. A board that can see Economic Buyer coverage on the top ten deals has a better forecast than one that can see last quarter’s attainment. Everyone can see last quarter. The job is to see this one.
From the journal